Dynamic Malware Analysis of Open Source Packages at Scale
Table of Contents
TL;DR
At SafeDep we build and operate a large scale open source package monitoring and static code analysis infrastructure. The goal of this infrastructure is to continuously analyse open source packages published in package registries such as npm, pypi, rubygems, Go Proxy etc. and find malicious packages. This service in turn powers tools like vet that provides developer and CI/CD guardrails against malicious open source packages. To learn more about this service, refer to Malicious Package Analysis docs.
The static code analysis workflow currently consists of
- YARA Forge rules
- Static Code Analysis to identify risky capabilities in code (e.g. filesystem, network, process operations)
- LLM based code analysis to identify malicious code blocks
- OSS Project and package metadata
- LLM based classification with our knowledge (prompt rules) and package specific context
While we are continuously extending this system by improving our code analysis based tools and eliminating known false positives, we believe static analysis will always have false positives and negatives. While the inherent benefit of static code analysis approach is to look at code — the source of truth, it is restricted by Halting Problem and in our use-case, by the Rice’s Theorem. For us, the security research & engineering problem is to make the right trade-off that makes the system effective in real life with the need for human intervention (manual analysis) reducing over time.
We started exploring the idea of building a complementary system that can verify and correlate static analysis findings. Thats where dynamic analysis comes in ie. the ability to run an open source package in an observed environment and determine its safety status based on real behavior at runtime. For us, the design goals of this system were:
- Run an open source package in a sandboxed environment
- Observe all runtime behavior
- Correlate with static analysis results and classify as malicious (or not) based on runtime evidences
We ended up building a solution by leveraging OSS tools with our custom platform tooling that can
- Execute open source package installation in a sandbox
- Observe the runtime behavior of the container through system call tracing using eBPF
- Collect tracer generated events, filter them and store (log) them in a database with a correlation ID
- Query event log to identify runtime behavior of packages flagged as malicious by our static analysis system
- Determine the approach for automated correlation and analysis to complement our static analysis based detection
Key Challenges
- How do you run an open source package that is essentially a library?
- What is a baseline runtime behavior that can be used to identify anomalies?
- Creating a repository of runtime behavior (rules) for MITRE ATT&CK
- Guarantee isolation and containment of package execution while observing & collecting data
- Achieve scale required to analyze every package published to a supported ecosystem (e.g.
npm) - Trade-offs to balance scale and accuracy
Technical Analysis
As a first step, our goal was to build a system that runs in parallel to our existing static code analysis infrastructure and perform the following
- Run an open source package
- Collect runtime behavior data (events)
- Persist runtime behavior data to a database
- Research and identify a classification system for malicious packages based on runtime behavior data
At this stage, we felt our technical requirements are similar to what is being solved by Google’s (or OpenSSF is it?) Package Analysis project. We did take inspiration from the system but unfortunately decided to build our own because
- It is coupled with Google’s internal infrastructure
- It already combines static analysis, we need the ability to correlate our static analysis results
- Avoid dependency on system tools such as
stracebut to hook into kernel’s system call interface - Support different executor environments, especially for sophisticated malicious payloads that can detect container environments.
- Emulate system calls and even machine instructions (eg. emulate
sleepor fakerdtsc)
We however took inspiration on some of the solutions in this project especially on running open source packages as implemented in dynamicanalysis package.
We had to solve the following problems before we can start working on an implementation
- How to run an open source package
- What sandboxing technology to use?
- How to monitor runtime behavior
Running Open Source Packages
We decided to start with simple installation commands ie. execute npm install .. or pip install .. However, future work involves attempting to load package files and execute exported functions on a best effort basis. Several challenges exist here:
- Finding exported functions in code are very ecosystem specific
- Identifying valid function parameters can only be best effort basis
- Executing every single exported function will not scale (for us)
- Avoid sleeps & IO waits in executed functions
- Handling errors and retries
An example malicious package that cannot be analyzed by simply running npm install ... is described at Malicious NPM Package Express Cookie Parser.
Solution Architecture
One of our design goals is to have the dynamic analysis system deployed initially in parallel to the existing static analysis system. This is to enable us to perform the R&D required to manually observe the runtime behaviour of known malicious packages and establish a baseline for non-malicious npm, python and other packages at install time.
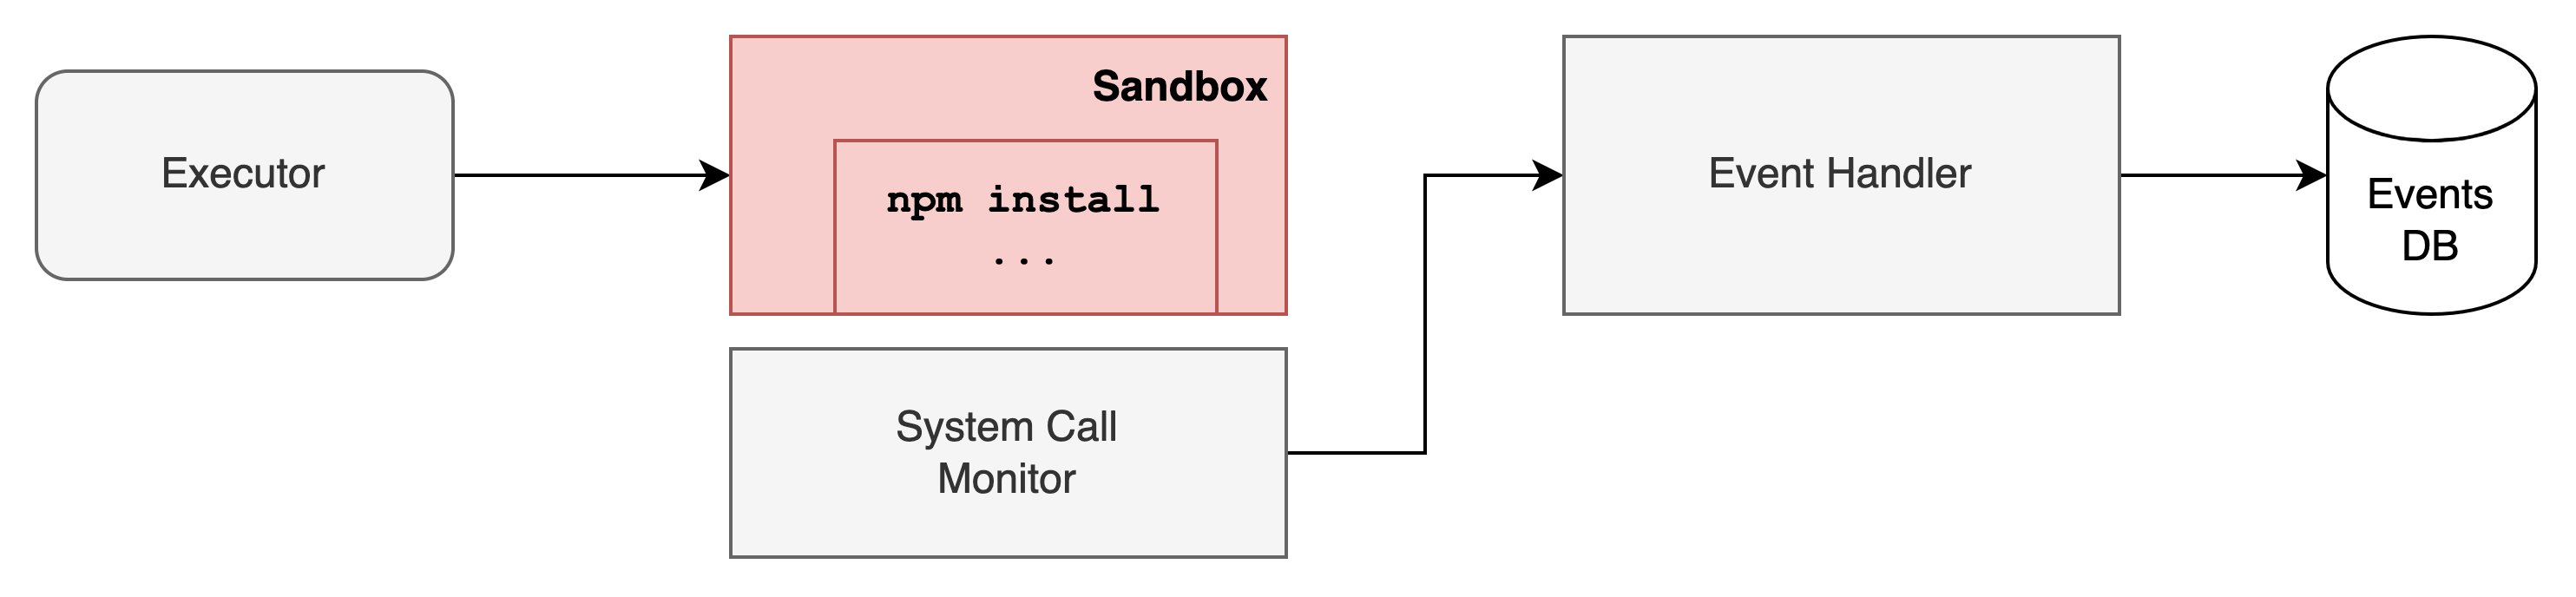
To ensure simplicity of design and loose coupling, we introduced
- An executor, that reads package analysis messages from our NATS (as another consumer group)
- Creates a new sandbox and execute package installation command in the sandbox
- The sandbox was created in a VM that is monitored using eBPF
- Monitor generated events are handled by a separate Event Handler that performs filtering and is a placeholder for future correlation with static analysis results
- Events database to store all captured events
Sandbox
The purpose of sandbox is to limit the blast radius because we are running untrusted and “expected” to be malicious packages with unknown payloads. While only air gap can provide true sandbox in an era when VMMs are being exploited. We made practical choices in terms of “reasonable” isolation, avoid unnecessary complexity while keeping options open for additional layers of protection for guarding against sophisticated attacks such as container escape, kernel exploits etc.
Threat Model
We considered the following threats as part of the sandbox design because we are executing untrusted and malicious code in our infrastructure
- Execute malicious code to spawn a reverse shell to gain interactive access in the sandbox
- Exploit vulnerabilities for privilege escalation and container escape
- Exploit vulnerabilities in operating system kernel
- Exploit network services within the locally accessible network
- Exploit vulnerabilities in virtual machine monitors (VMM) to break out of virtualization
Implementation
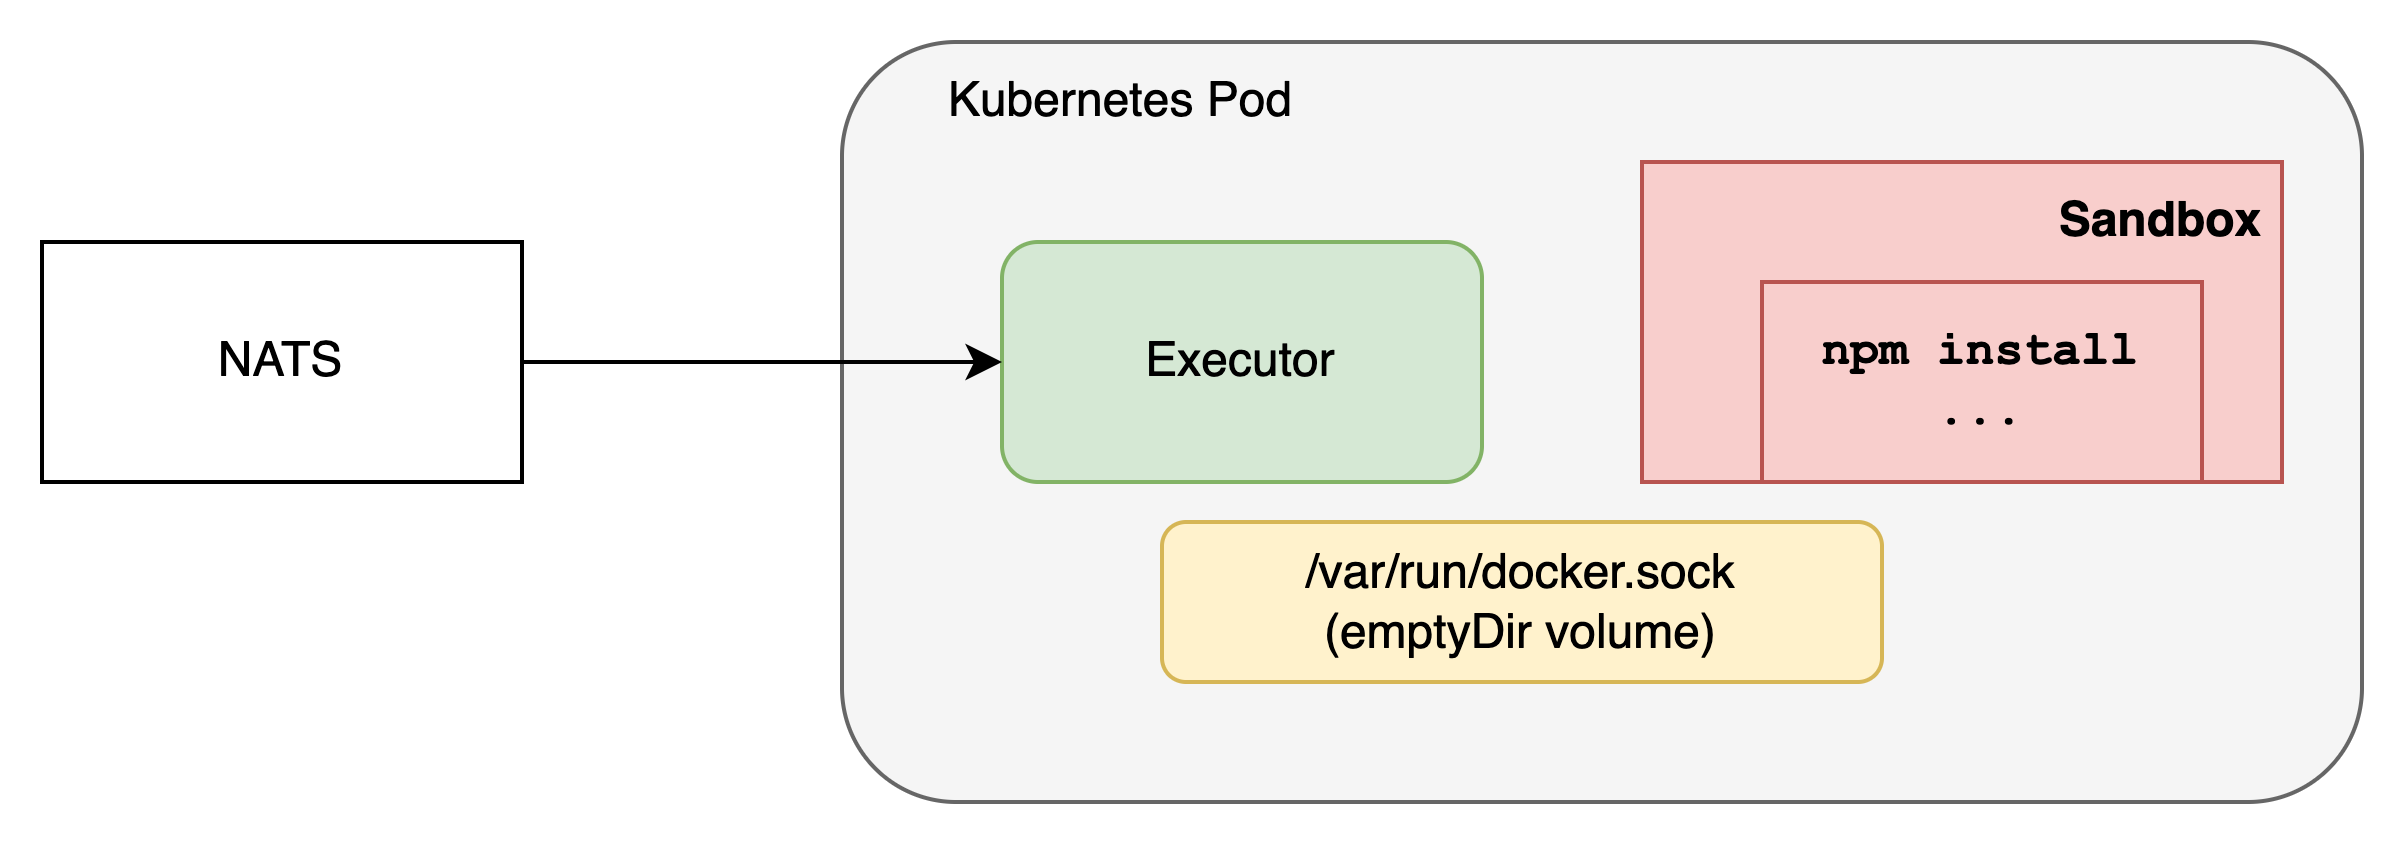
We decided to go for Docker container based sandbox with DIND. The choice primarily stems from
- Our platform runs on Kubernetes but we want to treat this as just another workload and not a low level service (eg. daemonset)
- Having DIND as a sidecar with the Executor and scaling horizontally with the Executor
- Keeping options open to deploy the “full stack” sandbox (Executor + DIND) in a separate VPC
- Limit communication over local unix sockets to be able to restrict DIND pods completely with NSP
- Leverage familiar Docker client APIs to create containers, execute commands and destroy containers
While the sandbox implementation choice was primarily for engineering simplicity and scalability, we did consider the threats as part of the infrastructure.
| Threat | Mitigation |
|---|---|
| Execute malicious code to spawn a reverse shell to gain interactive access in the sandbox | No mitigation. We want this to happen. Containers are ephemeral with hard deadline of execution to avoid long term persistence. Dedicated node pool and planned VPC isolation protects the rest of the infrastructure |
| Exploit vulnerabilities for privilege escalation and container escape | DIND provides additional layer of isolation using Linux kernel namespaces. Two container escapes will be required to break out of the sandbox into the underlying Kubernetes node. We plan to implement gVisor in future enhancement along with VPC isolation. |
| Exploit vulnerabilities in operating system kernel | Use dedicated Kubernetes node pool with taints and tolerations to guarantee that ONLY the executor pods are running in the node pool. No secret mounted into these pods. Leveraging Kubelet token for lateral movement across the cluster will be an interesting attack to observe |
| Exploit network services within the locally accessible network | Kubernetes Network Policy to prevent egress to local network CIDR from Pod. Google Cloud firewall rules at VM level to allow access only to Kubernetes API Server and container registry (read-only) required by Kubelet running in the node to pull the images |
| Exploit vulnerabilities in virtual machine monitors (VMM) to break out of virtualization | No mitigation. Our entire infra will be pwned with VMM escape vulnerabilities. The low level details are available in the paper Large Scale Cluster Management with Borg. |
Runtime Monitoring
The purpose of runtime monitoring solution is to observe package execution at system call level, generate events using a standard schema, use rules to classify “interesting” events and store the events in an event log for manual or automated analysis. The runtime monitoring solution is completely decoupled from the rest of the system and has the single responsibility of performing systems monitoring. However, we did consider following goals
- Must support Linux kernel and container monitoring (platform requirements)
- Monitor at OS level to reduce environmental footprint (eg. avoid dependency on
strace) - Trade-off application context for performance and stealth
We decided to go ahead with Falco as our observability technology. The choice was between
- Falco
- Building our own eBPF based solution
Going ahead with Falco was pretty much obvious for us because we are rolling out an R&D focussed experimental service. It doesn’t makes sense to invest in heavy lifting required for building and productionizing an eBPF based solution till we reach the limitations of the currently available options. In any case, Falco is a CNCF graduated project which indicates the maturity of the solution and meets all our current requirements especially the ability to write custom rules to match various system call parameters.
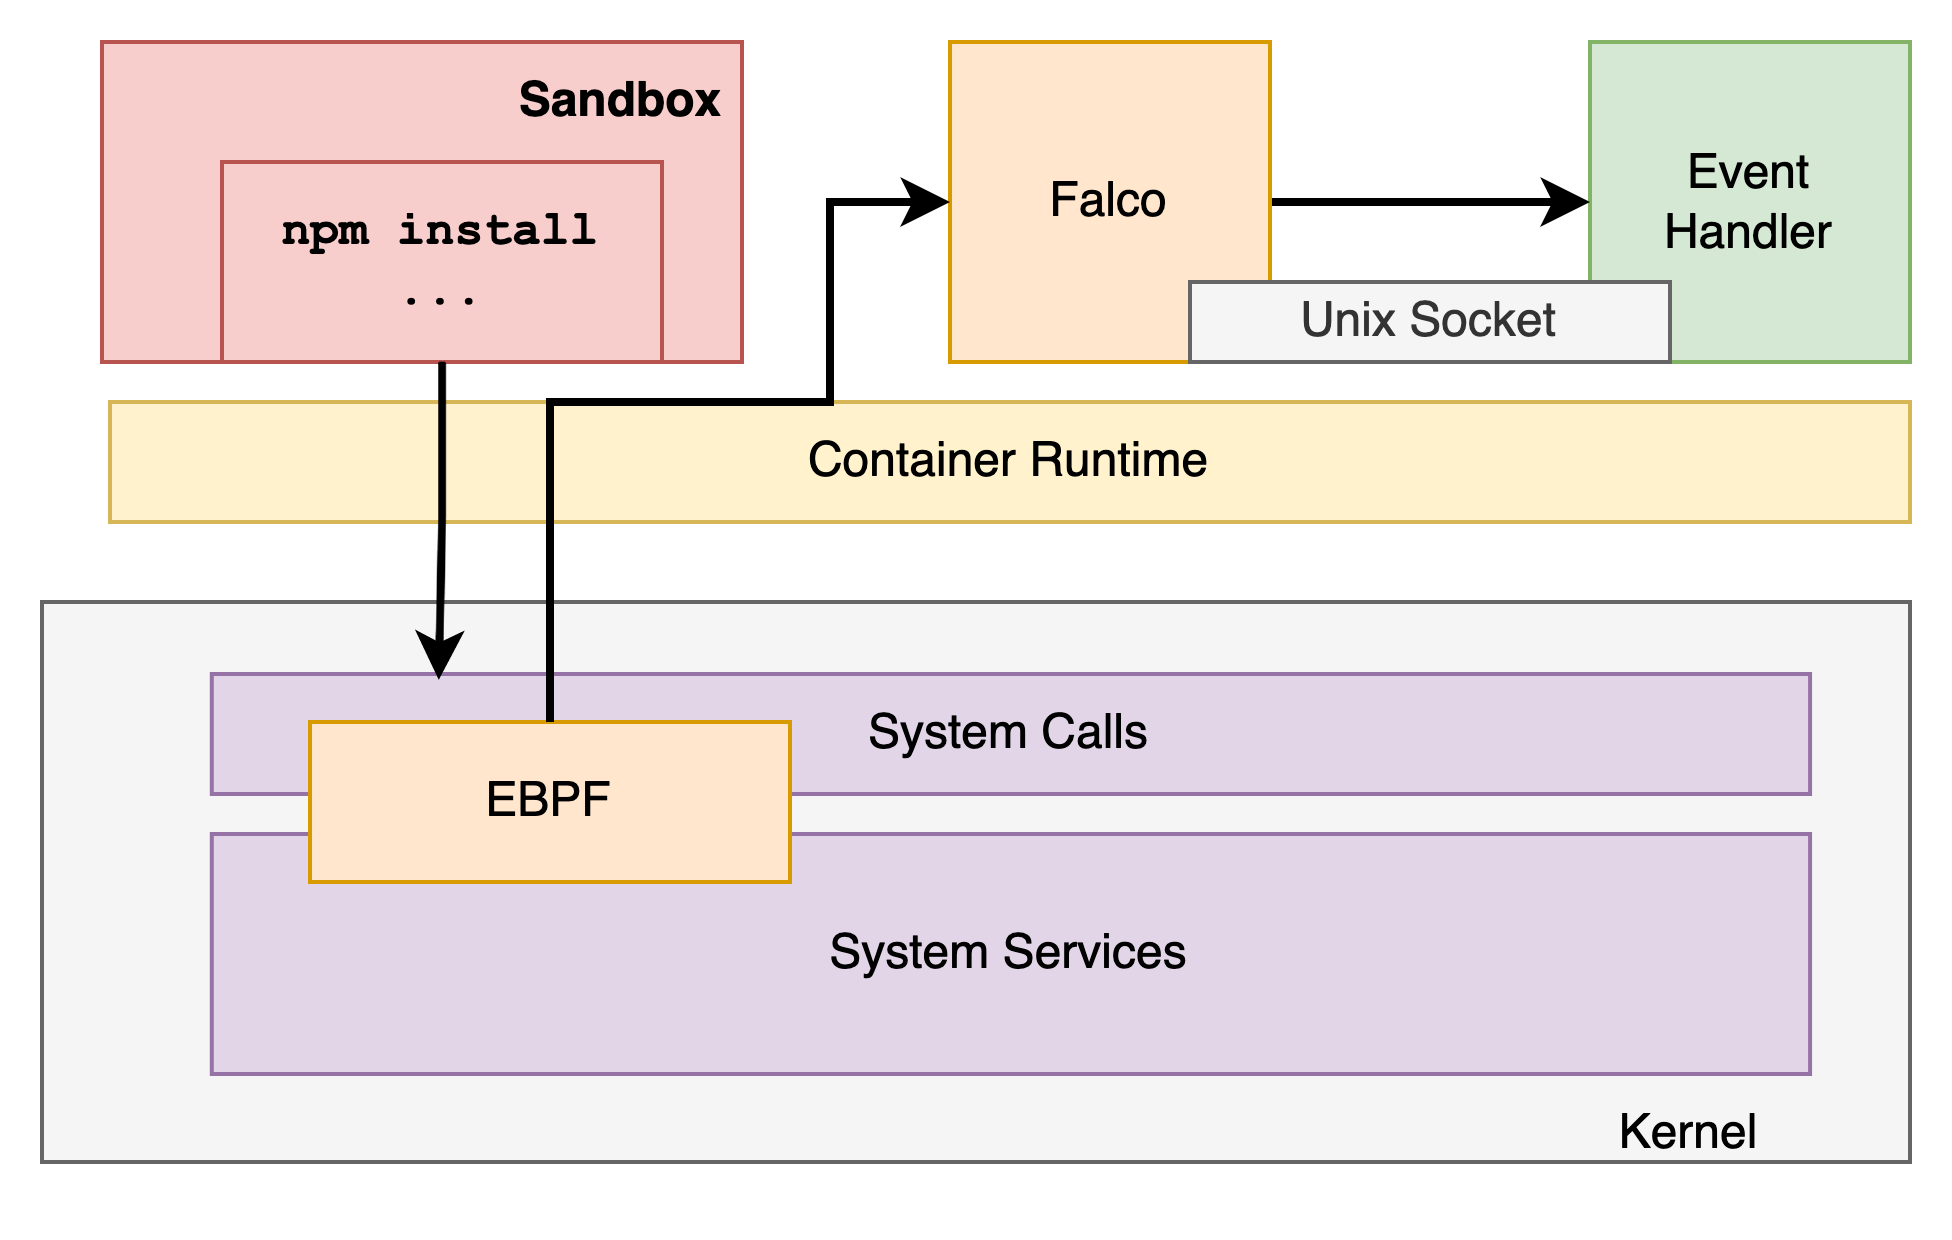
- Falco and Event Handler deployed as Kubernetes DaemonSet
- Falco and Event Handler share
emptyDirvolume for Falco gRPC socket - Event Handler is a gRPC client reading Falco events from unix socket
- Event Handler integrates the system with rest of the platform by persisting the event into a database
- Future iterations will have the event handler stream to events to NATS for analysis and correlation
Observations
Lets start with quick stats and challenges
- 100k+ events persisted in database within an hour in production
- 12,491,123 events in DB at the time of writing with < 2 weeks in production
- Falco does not allow
ip != Xbased filtering becauseXis resolved at the time of rule parsing - Every package manager has its own initializer footprint generating events but baselining is tricky due to behavior differences across versions
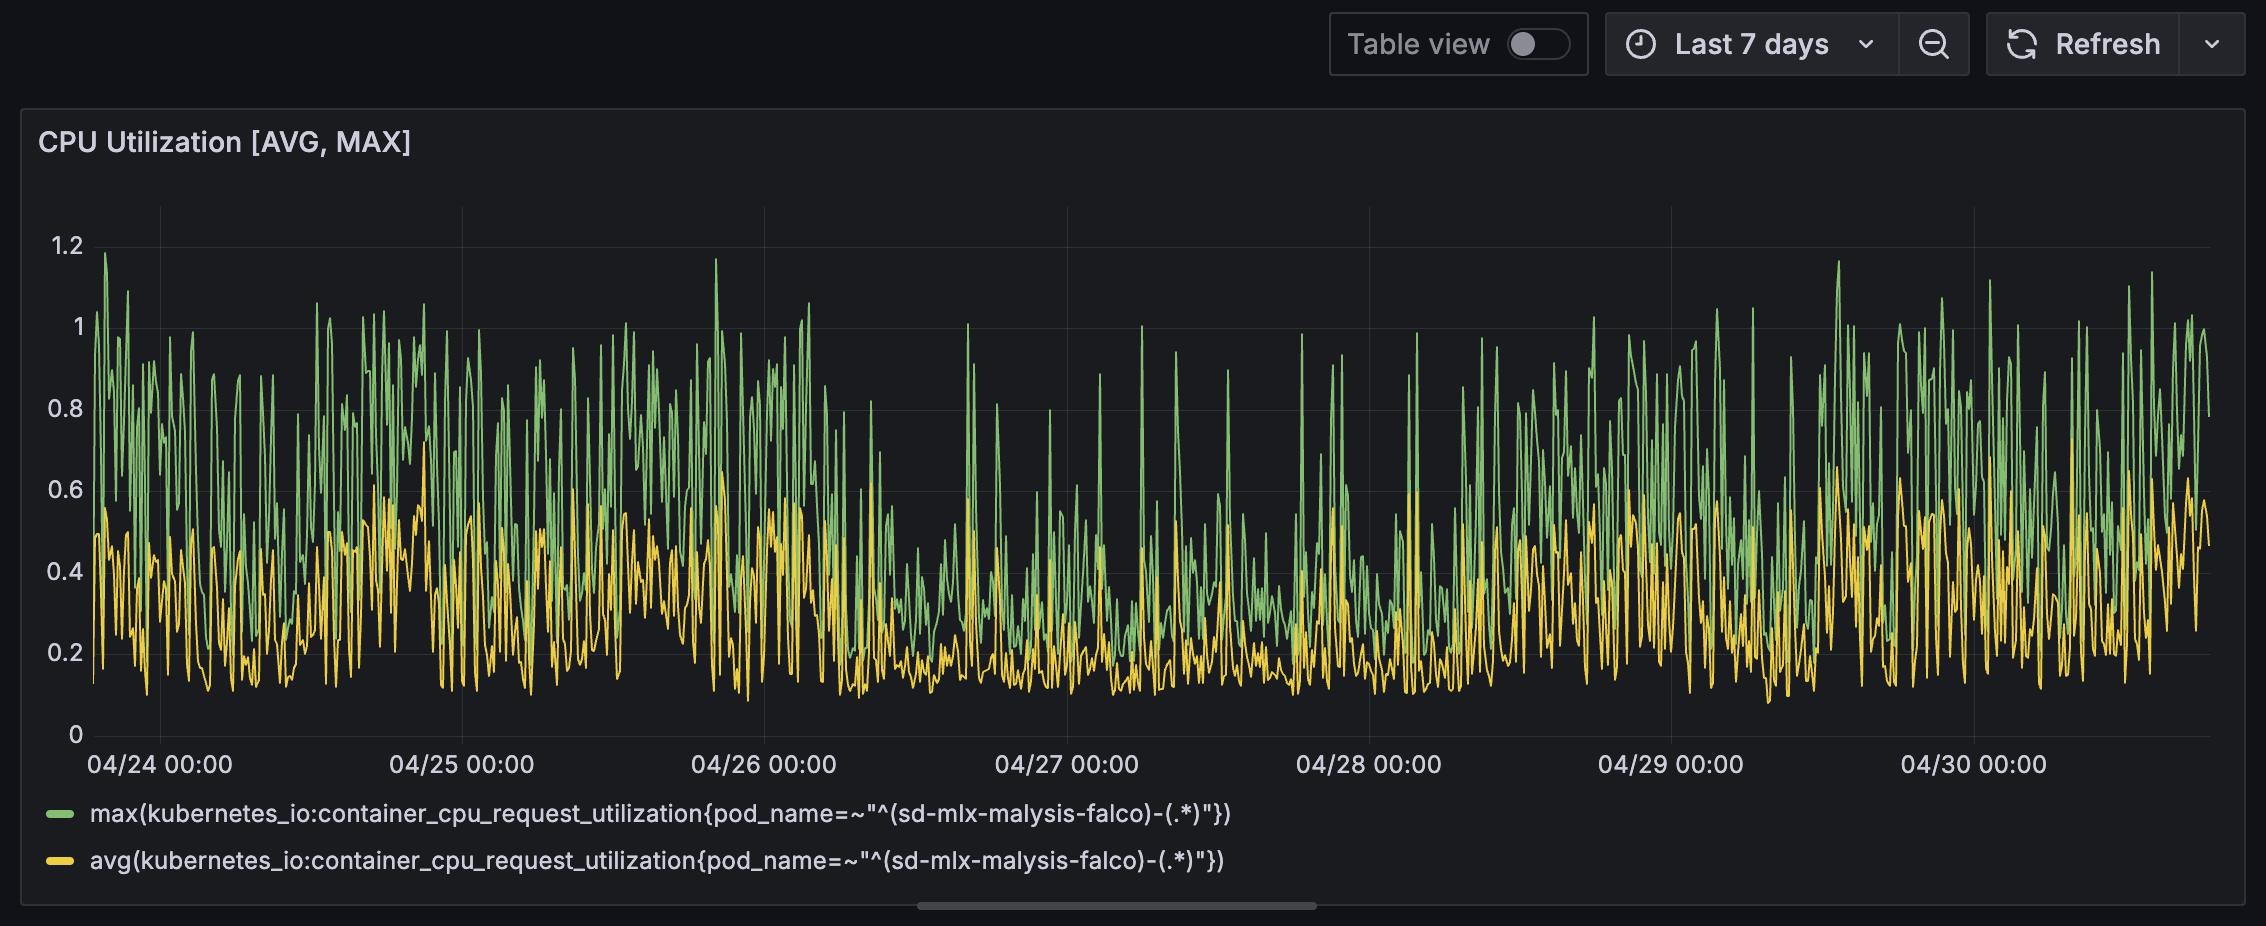
Performance
*n2d-standard-4*is used as the Node type for dynamic analysis, consisting of 4 CPU and 16 GB RAM per node- Falco and Event Handler containers are deployed with
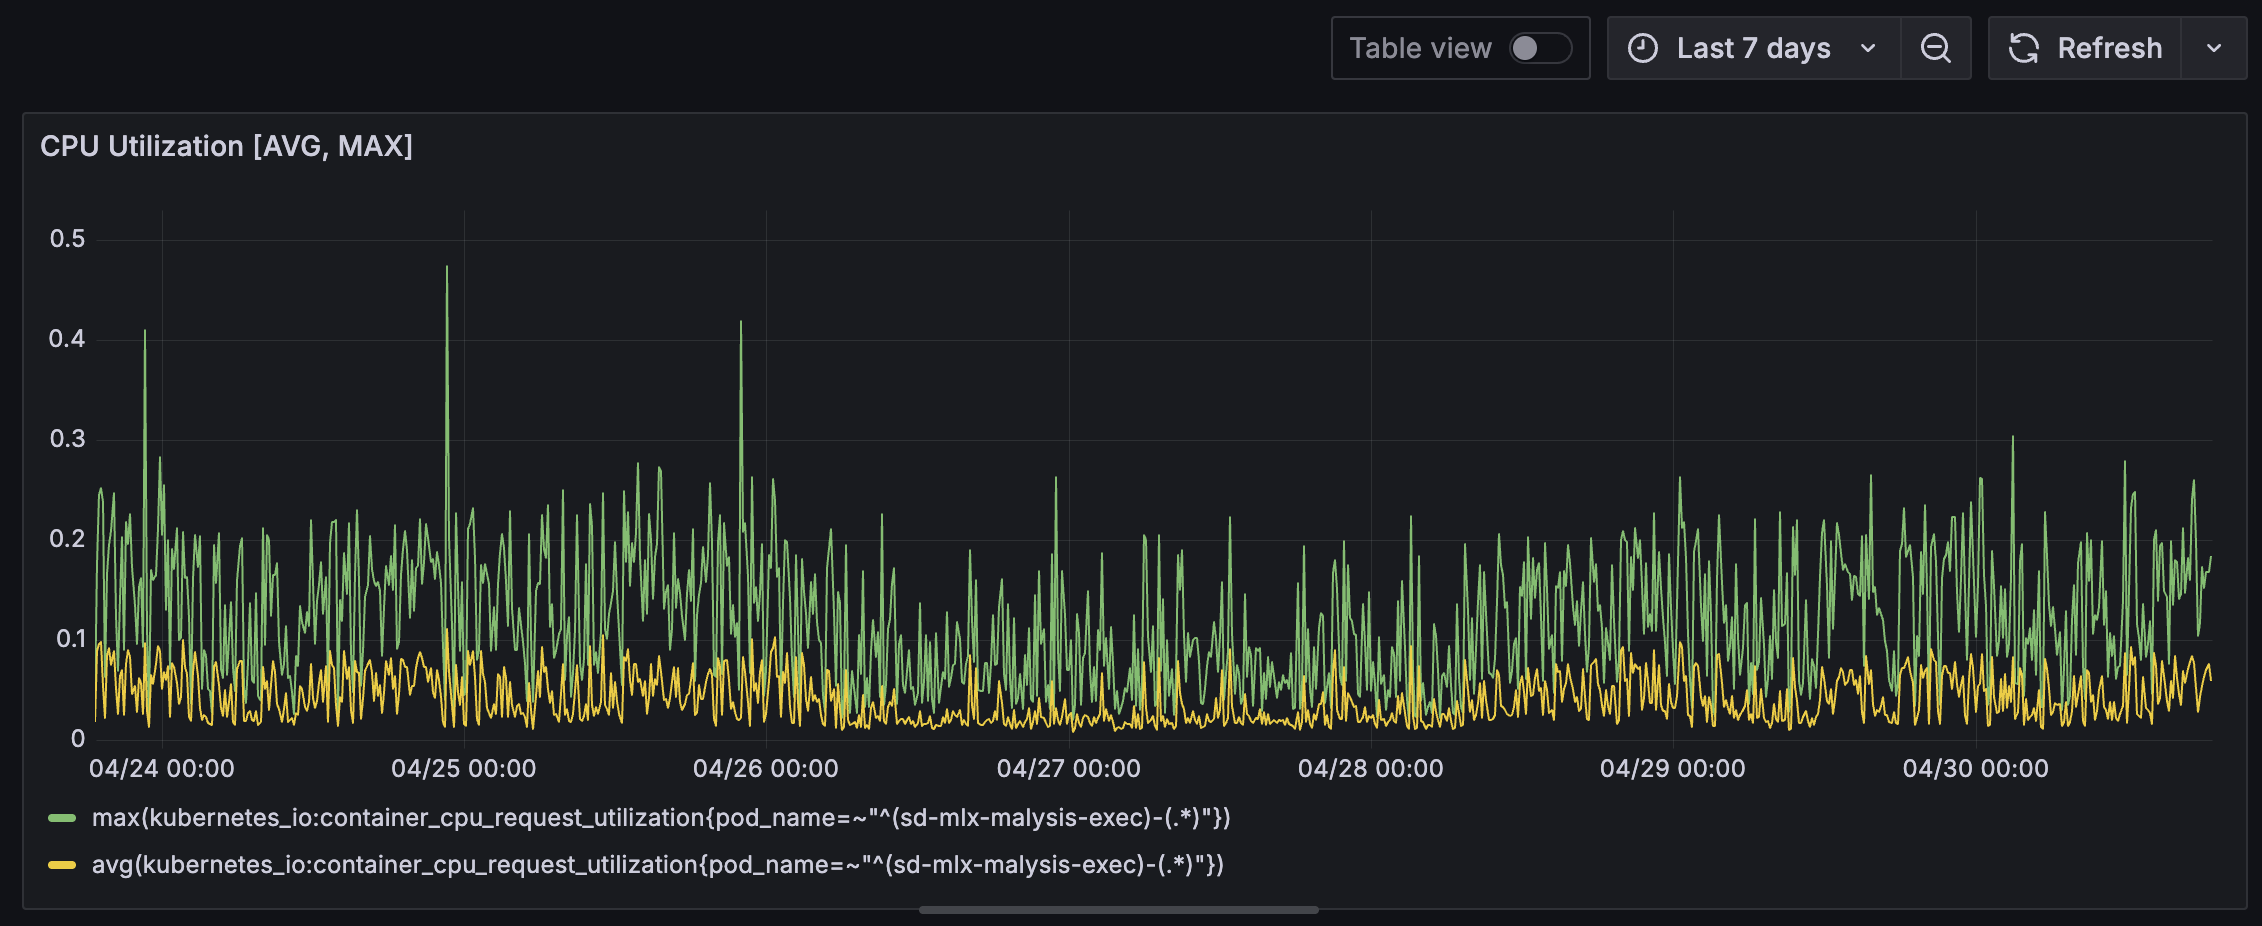
100m(10% of 1 CPU) CPU and 256Mb memory limit each - Executor (NATS listener) is deployed with
100mCPU and 256Mb memory limit - DIND container is deployed with
500mCPU and 512Mb memory limit
The executor, consisting of NATS listener and DIND container shows low CPU usage indicating potential over provisioning of resources.
The Falco and Event Handler pods (DaemonSet) on the other hand shows CPU spikes. This is almost certainly due to Falco containers that has higher CPU load due to rule matching on system calls.
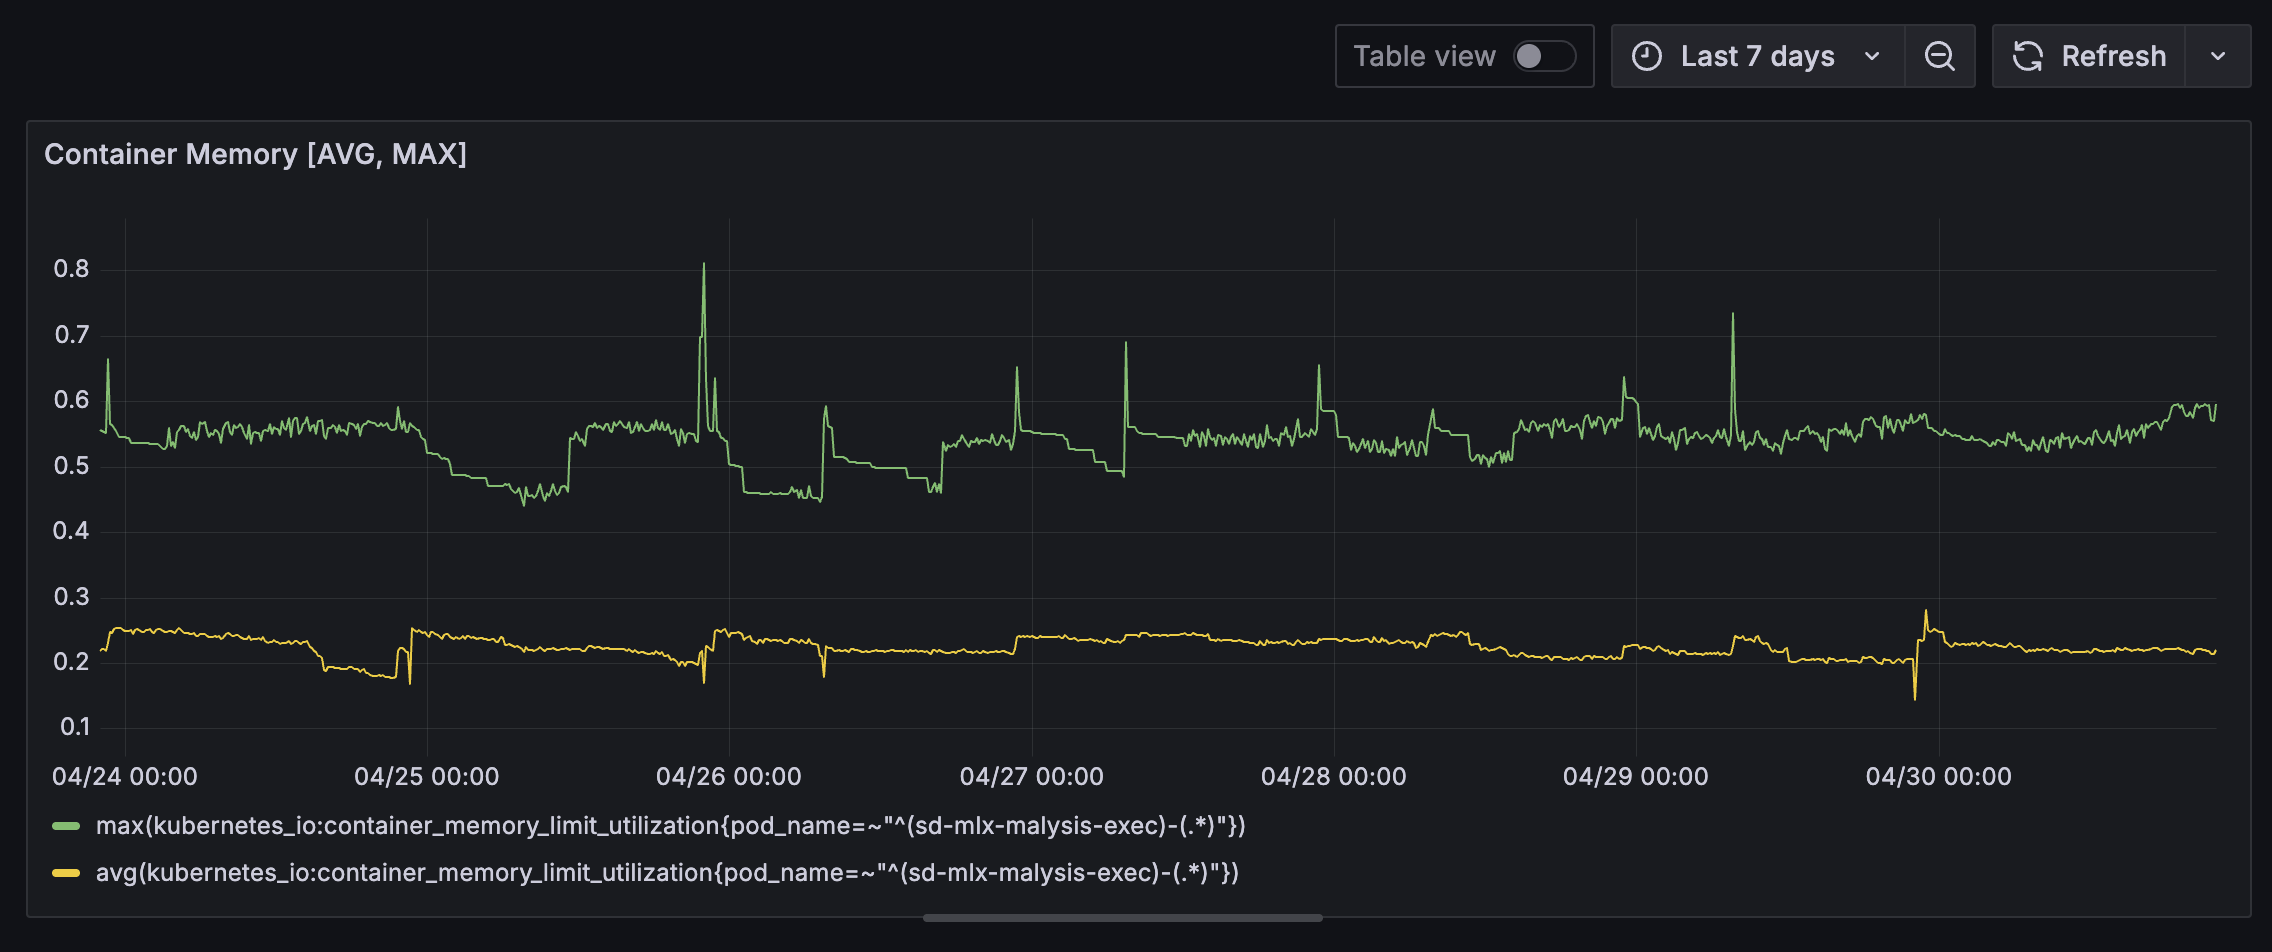
Executor (NATS Listener and DIND) memory usage is pretty stable with occasional spikes. It will be curious to identify which packages caused these spikes. At this point, we are guessing that they are caused by packages that required platform specific compilation during installation.
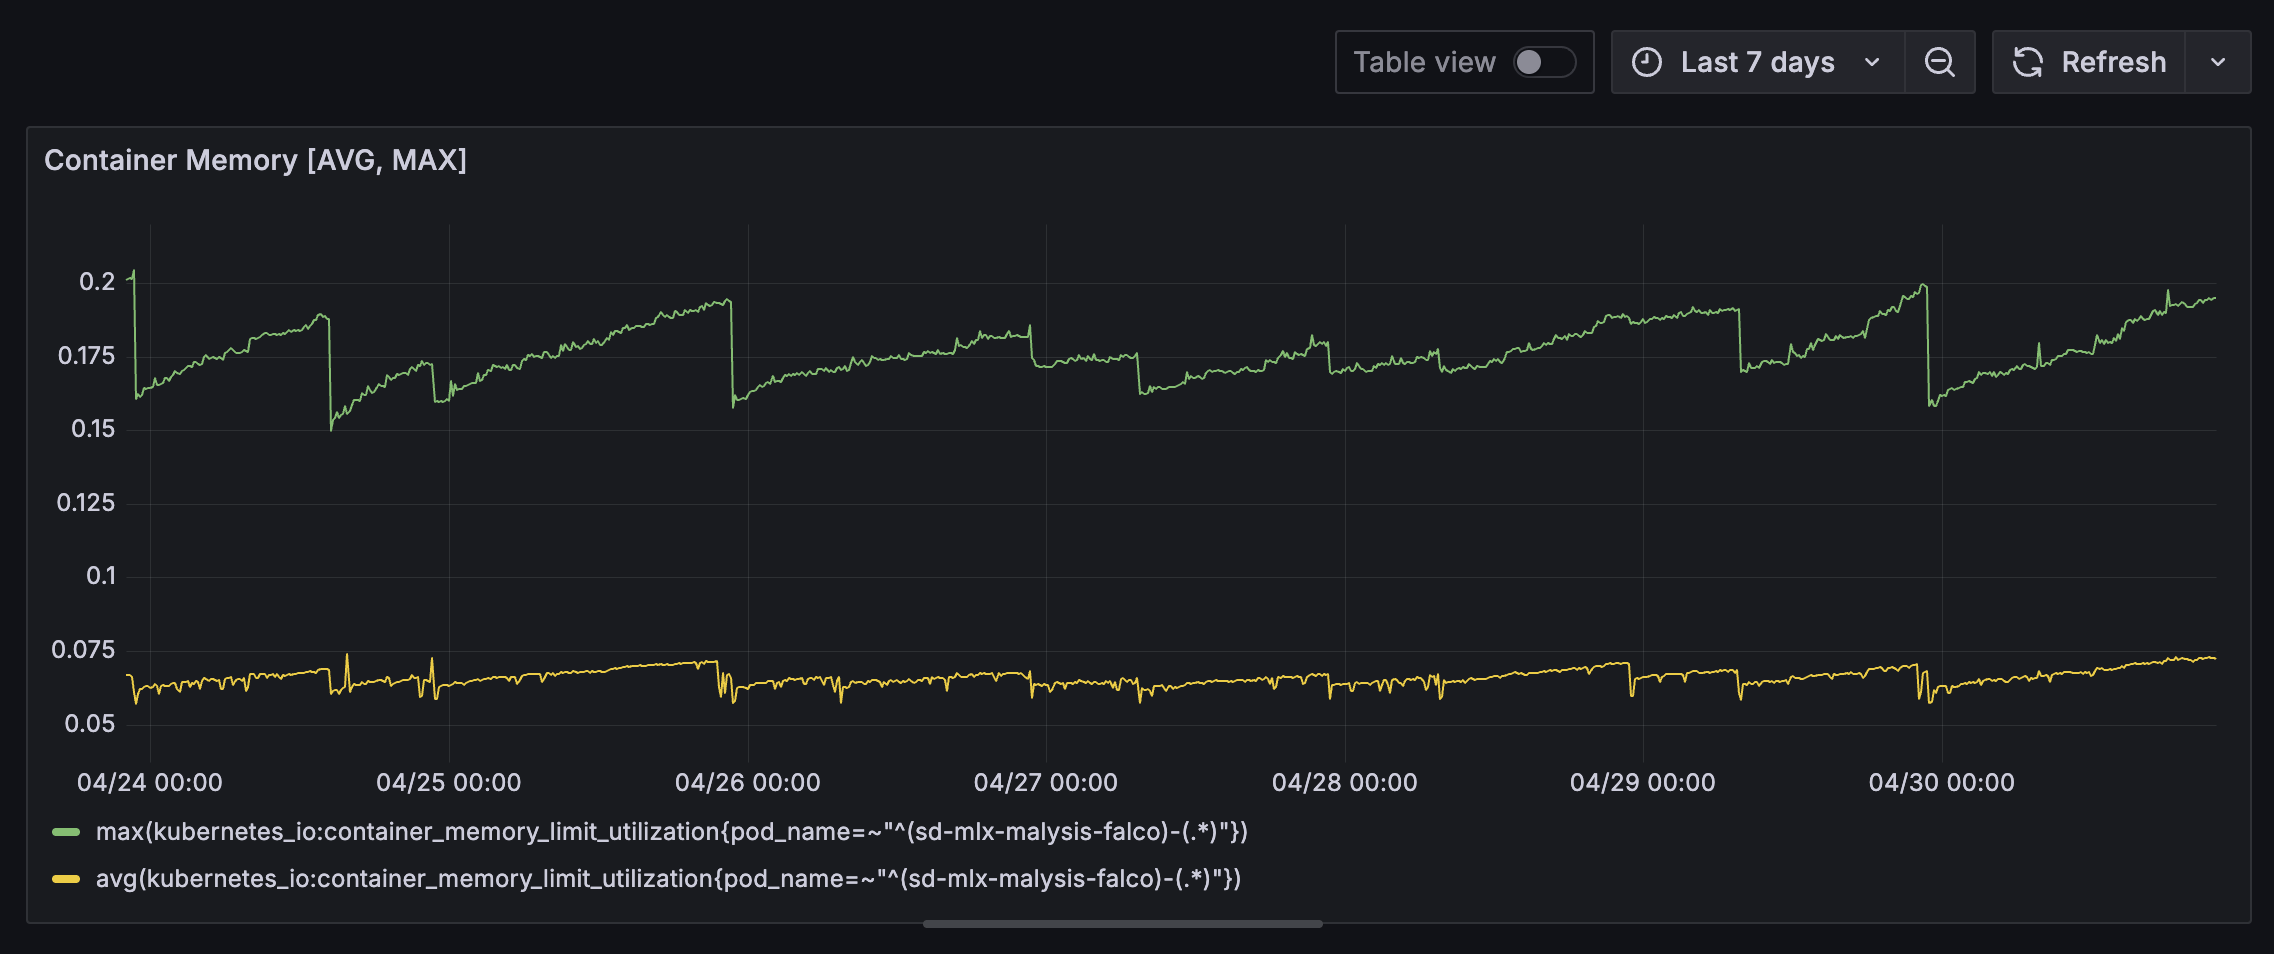
Falco containers however shows sign of memory leak. This may be related to a known issue. Our Go based Event Handler may also contribute due to high throughput of event processing and the way Go GC works. Deeper analysis is required to identify the root cause of this memory usage patterns.
Whats next?
The technology stack that we built and deployed for runtime analysis is tuned for scale. As per the initial design goal, we have the necessary infrastructure in place to start correlating runtime behavior with our static analysis results. We now can independently perform research on OSS package install time behavior at scale. However, we believe the core value to our users and the large community lies in
- Eliminating noise
- Identifying real malicious packages through its runtime behavior
- Correlate with static analysis infrastructure and reduce false positives
There are multiple challenges to solve when it comes to classifying runtime behavior that we have observed so far such as
- Command execution is not unusual during installation stage e.g.
esbuildnode-gypmakeand other build tools required to build platform specific binaries by Python, Node or other ecosystem packages - Package managers have their own initialization footprint that varies across versions due to which base-lining is tricky
- Build telemetry is indistinguishable from malicious C2 behavior especially when it comes to operating at scale without deep packet inspection
For us the next steps are to identify heuristics and create an approach for base-lining ecosystem specific package installation behavior to identify anomalies. Future work also involves
- Identify sophisticated malicious packages that do not trigger on installation such as https://safedep.io/malicious-npm-package-express-cookie-parser/
- Improve coverage of code execution
- Minimize environmental footprint to avoid malicious code from detecting the analysis environment
- Improve custom rules to better detect malicious payloads
References
- dynamic-analysis
- oss
- malware
- security
Author
SafeDep Team
safedep.io
Share
The Latest from SafeDep blogs
Follow for the latest updates and insights on open source security & engineering
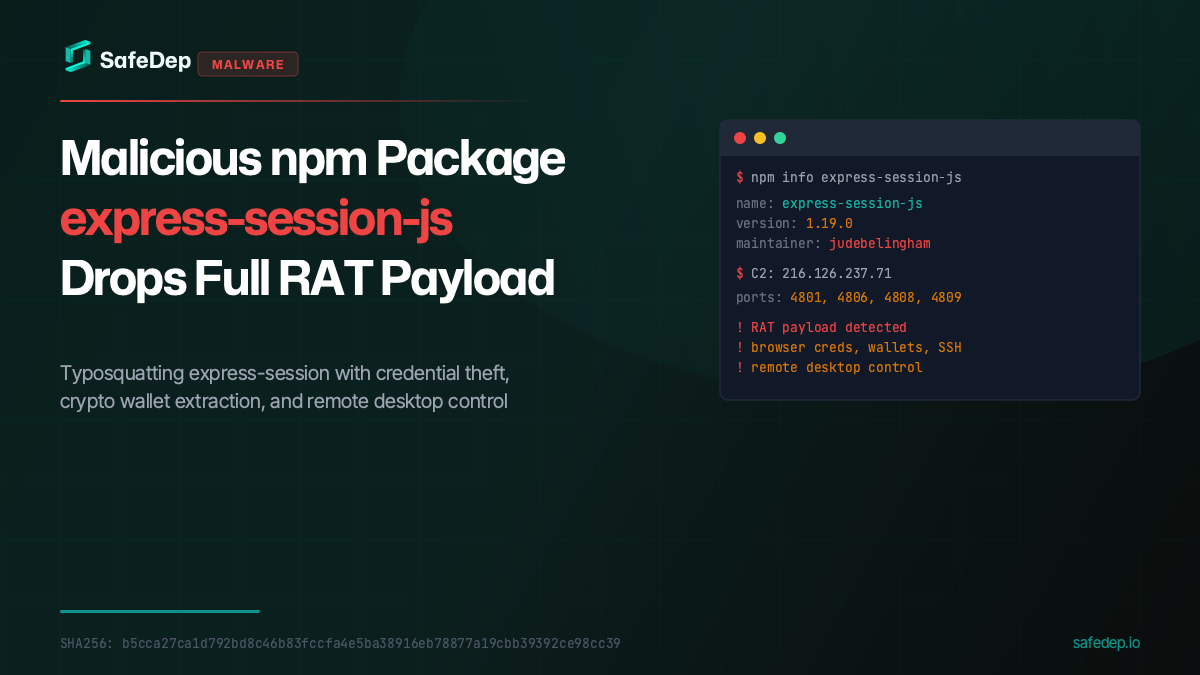
Malicious npm Package express-session-js Drops Full RAT Payload
A malicious npm package typosquatting express-session fetches and executes a full Remote Access Trojan from a paste service, targeting browser credentials, crypto wallets, SSH keys, and more.
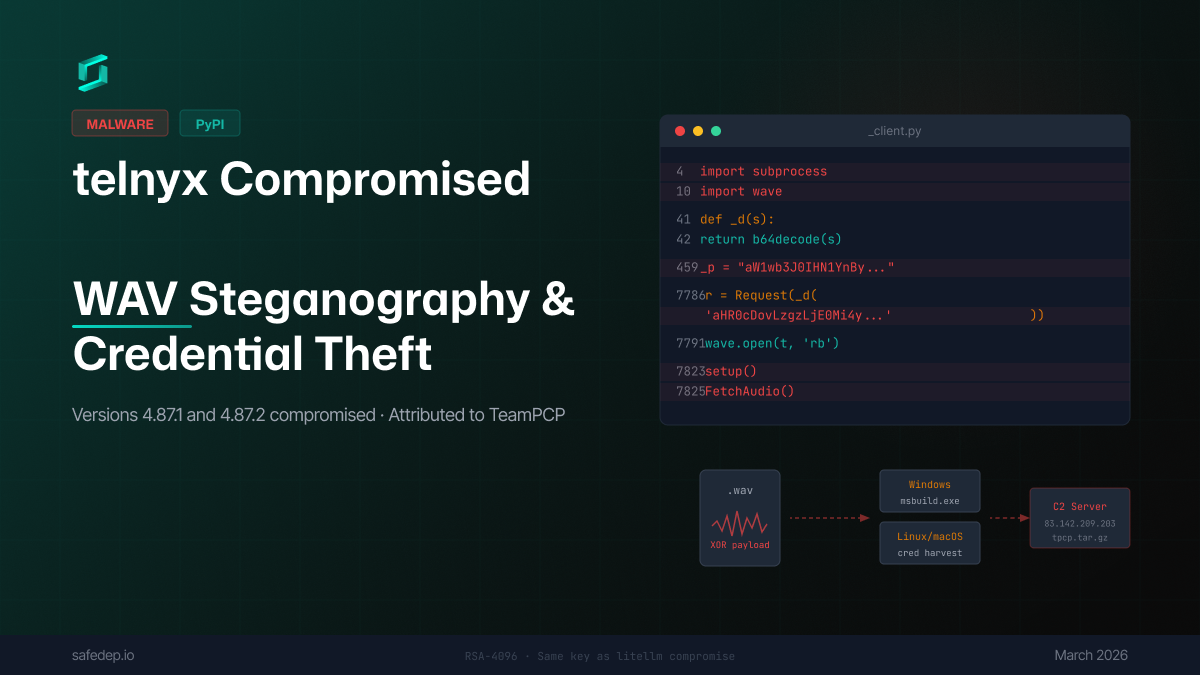
Compromised telnyx on PyPI: WAV Steganography and Credential Theft
Analysis of malicious telnyx 4.87.1 and 4.87.2 on PyPI — a package with over 1 million monthly downloads: injected code uses WAV audio steganography to deliver payloads that steal credentials and...
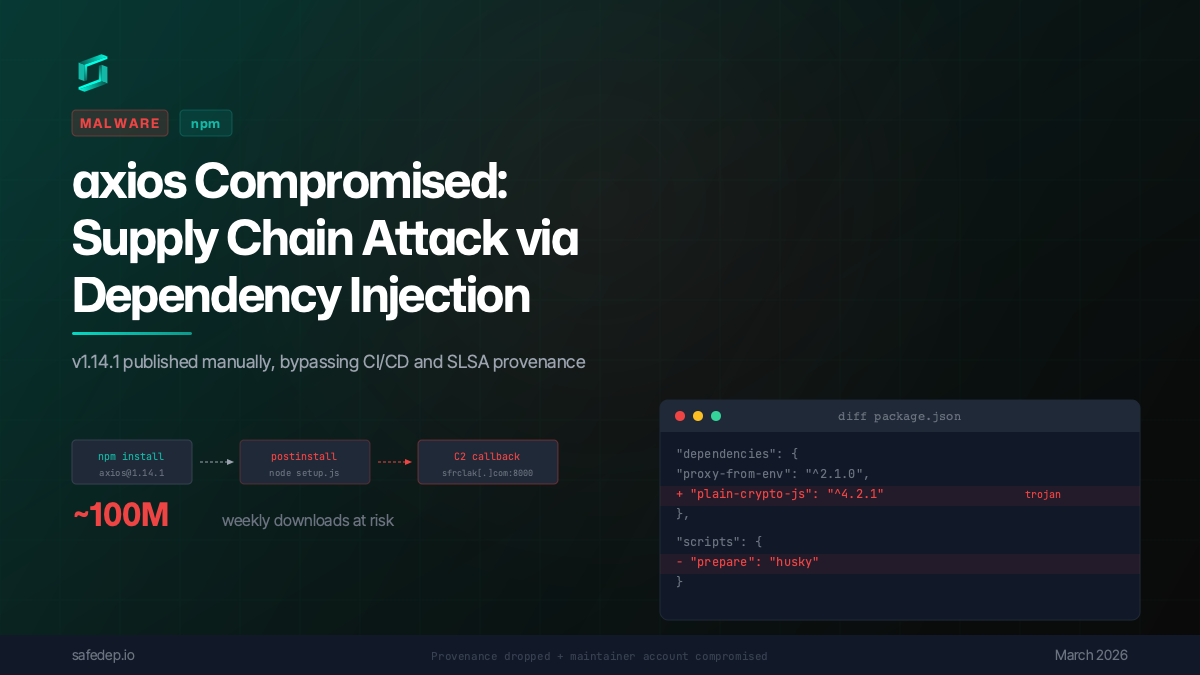
axios Compromised: npm Supply Chain Attack via Dependency Injection
axios 1.14.1 was published to npm via a compromised maintainer account, injecting a trojanized dependency that executes a multi-platform reverse shell on install. No source code changes in axios...
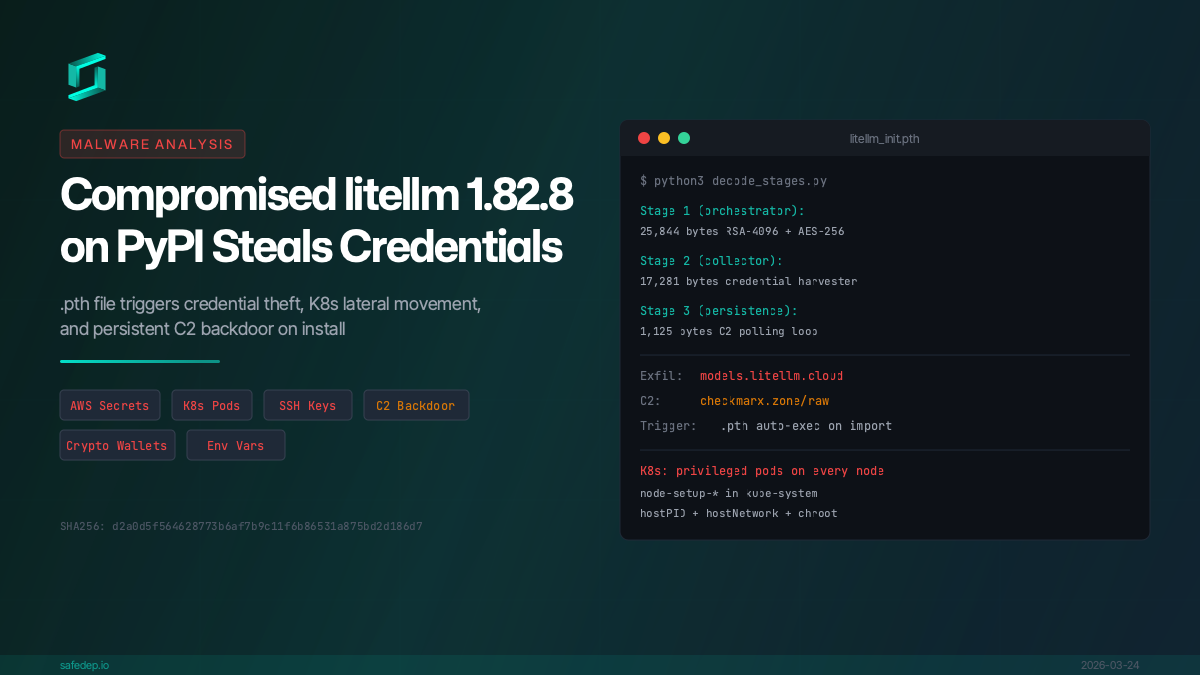
Malicious litellm 1.82.8: Credential Theft and Persistent Backdoor
Analysis of compromised litellm 1.82.8 on PyPI: a .pth file triggers credential theft, AWS/K8s secret exfiltration, and persistent C2 backdoor on install.

Ship Code
Not Malware
Install the SafeDep GitHub App to keep malicious packages out of your repos.
